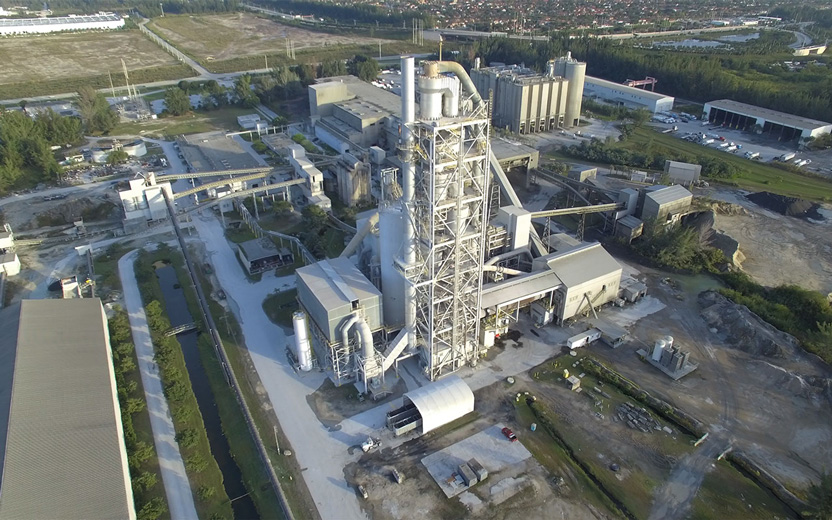
Total shipments of portland and blended cement, including imports, in the United States and Puerto Rico in March were an estimated 8.07 million metric tons (Mt), a 1.4% increase from 7.96 Mt in March 2024, according to the most recent USGS Mineral Industry Survey. Shipments for the year through March totaled an estimated 19.8 Mt, a 7.5% decrease from those for…
Read MoreMarch Cement Shipments See Slight Bump